Do you trust your calculations?
This book review is about The Los Alamos Primer, the first lectures on how to build an atomic bomb, by Robert Serber. The review focuses on the basic calculations and physics knowledge of the Manhattan Project scientists. Since the Primer is a collection of 1943 lecture notes combined with Serber’s hindsight commentary, it corrects some of the original calculations and measurements by comparing them with modern values. This makes it fascinating to see how close, or off, the physicists were at the time. For anyone interested in the topic, I highly recommend reading both the Primer and The Making of the Atomic Bomb by Richard Rhodes, one of my all-time favorite books.
The history behind the Primer is remarkable: these lectures were given to every physicist arriving at Los Alamos in the spring of 1943. It is fascinating to read the material that guided the people responsible for building the first atomic bomb. My main goal in this post is to keep the essential physics concepts simple and accessible, while sometimes diving deep into the rough calculations to capture the knowledge and uncertainty the scientists experienced back then.
Every symbol in the formulas is underlined with dots. Hover over it, or tap it on a phone, to see what it stands for.
Building a Practical Military Weapon
First and foremost, it’s important to note that the Manhattan Project had a clear goal: building a practical military weapon for massive destruction. Although this sounds extreme, the primary motivation was to beat Nazi Germany and minimize overall damage. The original text states:
The object of the project is to produce a practical military weapon in the form of a bomb in which the energy is released by a fast neutron chain reaction in one or more of the materials known to show nuclear fission.
In the lectures, the word bomb was replaced by gadget, and by “practical” they meant that it was light and small enough to be transported by an airplane, not a heavy object weighing several tons like a nuclear reactor.
The primary process exploited in the construction of the first nuclear weapons was the release of energy from nuclear fission (later, hydrogen bombs based on nuclear fusion were developed). In the early 1930s, Enrico Fermi and his colleagues bombarded various nuclei with neutrons, operating under the assumption that these interactions would transmute the nuclei into heavier elements. It was only later, in the winter of 1938, that Otto Hahn, Fritz Strassmann, Lise Meitner, and Otto Frisch analyzed the reaction products of neutron bombardment on uranium and discovered that the process resulted in the splitting of the nucleus rather than its transmutation. Their breakthrough demonstrated that, among naturally occurring elements, only uranium (specifically the fissile isotope \(\mathrm{U}^{235}_{92}\) ) is readily splittable by neutron-induced reactions. Although early nuclear devices eventually employed both uranium and synthetic plutonium, it was uranium’s unique ability to undergo fission that provided the essential foundation for the atomic bomb.
Back of the Envelope Energy Considerations
In order to provide some everyday energy comparisons, here is an energy unit conversion table for reference (all have the same dimension of \(\frac{\tip{M}{mass}\,\tip{L^2}{length squared}}{\tip{T^2}{time squared}}\) ):
| J (Joule) | kWh | cal (Calorie) | eV (Electronvolt) | erg | kt (kiloton) TNT |
|---|---|---|---|---|---|
| \(1 \text{ J}\) | \(3.6 \times 10^6 \text{ J}\) | \(4.184 \text{ J}\) | \(1.602 \times 10^{-19} \text{ J}\) | \(10^{-7} \text{ J}\) | \(4.184 \times 10^{12} \text{ J}\) |
per bond. Thus, nuclear fission is roughly \(10^8\) times more energetic per event than chemical reactions. Since the energy output of a detonation is critical for weapon design, it was immediately evident to physicists that a weapon based on fission would possess enormous destructive power.
The energy released from splitting a uranium nucleus can be understood through binding energy calculations that consider, among other contributions, the electrostatic (Coulomb) repulsion between protons. Although the energy difference is often expressed via Einstein’s mass-energy equivalence, \(\tip{E}{energy} = \tip{m}{mass}\tip{c}{speed of light}^2,\) this relation serves only to convert the binding energy difference into an equivalent mass defect; it does not imply that relativistic effects play a role in the fission process.
\[ \tip{E}{Coulomb energy: the electric repulsion stored in the nucleus} = \frac{1}{4\pi\tip{\epsilon_0}{vacuum permittivity, sets the strength of the electric force}}\frac{3}{5}\frac{\tip{Q}{total electric charge of the nucleus}^2}{\tip{R}{radius of the nucleus}} \quad \text{with} \quad \tip{Q}{total electric charge of the nucleus} = \tip{Z}{proton number: protons in the nucleus} \tip{e}{charge of a single proton}. \] \[ \tip{\Delta E}{energy freed by the split} \approx 370 \text{ MeV}. \]Where the 370 MeV comes from
(The exact arithmetic gives \(990 \text{ MeV}\) .)
\[ \tip{R_{\text{frag}}}{radius of one fragment} \approx \frac{7.4}{\sqrt[3]{2}} \approx 5.9 \text{ fm}. \] \[ \tip{E_{\text{frag}}}{Coulomb energy of one fragment} \approx \frac{3}{5} \times 0.25 \times 2100 \text{ MeV} \approx 310 \text{ MeV}. \] \[ \tip{\Delta E}{energy freed by the split} \approx \tip{E_{\text{U}}}{Coulomb energy of the uranium nucleus} - 2 \tip{E_{\text{frag}}}{Coulomb energy of one fragment} \approx 990 - 620 \approx 370 \text{ MeV}. \]remarkably close to the measured \(200 \text{ MeV}\) . From here on I use the measured value, \(200 \text{ MeV} \approx 3.2 \times 10^{-11} \text{ J}\) per fission.
Where the 180 MeV surface energy comes from
of extra surface energy.
Energy Yield from Partial Fission
In practical applications (both in bombs and reactors) it is very difficult to achieve complete fission of all available fissile material. For instance, suppose that only \(1\) % of the uranium in a sample undergoes fission. Take \(1\) g of uranium-235. Counting the atoms and multiplying by the energy per event gives about \(220 \text{ kWh}\) .
The 1 g calculation
For comparison, if one could fission \(100\) % of that \(1\) g of uranium, the energy released would be roughly \( 22000 \text{ kWh},\) which is about \(6\) times the average annual household electricity consumption in Austria (typically around \(3500 \text{ kWh}\) per year). This stark contrast illustrates the tremendous energy density of nuclear fuel: even a tiny mass can, in principle, release energy comparable to that used by an entire household over a year, provided that complete fission were achieved.
Early Nuclear Devices: A Quick Comparison
Below is a summary table of three historic early atomic bombs in the Trinity Test, Hiroshima and Nagasaki. While exact numbers vary by source, the values here illustrate the relative mass of fissile material, efficiency (the fraction actually fissioned), and the corresponding difference between maximum theoretical yield (if all fissile material were consumed) and actual yield.
| Device | Material | Mass (kg) | Efficiency (%) | Theoretical Yield (kt TNT) | Actual Yield (kt TNT) |
|---|---|---|---|---|---|
| Trinity | Pu-239 | ~6.2 | ~17 | ~105 | ~21 |
| Little Boy | U-235 | ~64 | ~1.5 | ~1000 | ~15 |
| Fat Man | Pu-239 | ~6.2 | ~17 | ~105 | ~21 |
These estimates highlight both the tremendous energy potential of nuclear fission and the engineering challenges of achieving high fission efficiencies in practice.
Chain Reaction
Splitting the atom is only half of the reason why bombarding a nucleus with neutrons can yield so much energy. When a nucleus is split by a neutron, it not only breaks into two or more fragments but also emits additional neutrons, which may strike other nuclei. The key question is: How many neutrons are released on average by each fission event? Only if this average number is at least \(1\) does the process sustain or even accelerate itself, leading to a Chain Reaction. By “chain reaction,” we mean exponential growth in the number of fissioned atoms. For instance, if two neutrons are produced on average per fission, the sequence of split atoms goes 1, 2, 4, 8, 16, … and so on, describable by
\[ \tip{N(t)}{number of atoms split in generation t} = \tip{N_0}{number of atoms split at the start} \times \tip{k_{eff}}{effective reproduction factor: new fissions caused by one fission}^{\tip{t}{time, counted in generations of the chain}}, \]where \(\tip{N(t)}{number of atoms split in generation t}\) is the number of atoms split at time \(\tip{t}{time, counted in generations of the chain}\) and \(\tip{k_{eff}}{effective reproduction factor: new fissions caused by one fission}\) is the effective reproduction factor. It has to be higher than 1, preferable around 2 in order to sustain a chain reaction in an atomic bomb. Try dragging the slider below across \(k_{eff}=1\) to see how quickly the neutron population runs away once the reaction goes supercritical.
Because the average number of neutrons emitted per fission is so crucial, it is termed the Neutron Number and denoted by the symbol \(\tip{\nu}{neutron number: neutrons released per fission, on average}\) . This number depends strongly on both the energy of the incoming neutron and the material itself. Another important material property is the Fission Cross Section. Each nucleus has a geometrical cross section \(\tip{\sigma}{geometric cross section: the area a nucleus presents to a neutron}\) reflecting its size. The fraction of collisions that actually induce fission times \(\tip{\sigma}{geometric cross section: the area a nucleus presents to a neutron}\) gives the fission cross section, \(\tip{\sigma_f}{fission cross section: the effective target area for fission}\) . If a neutron does not induce fission, it can be emitted again with either lower energy (inelastic scattering) or roughly the same energy (elastic scattering). The latter process is governed by quantum mechanics. At very low neutron energies, quantum effects (stemming from the Heisenberg uncertainty principle) can become so pronounced that the fission cross section appears larger than the purely geometrical one. However, in the scenarios of interest here, the neutrons remain too energetic for such resonance effects to dominate as we will see in a minute.
Elements
Besides the neutron number \(\tip{\nu}{neutron number: neutrons released per fission, on average}\) and the fission cross section \(\tip{\sigma_f}{fission cross section: the effective target area for fission}\) , it is also interesting for a material how much energy an incoming neutron must have to induce fission and how much energy the emitted neutrons from a fission process have.
The only naturally occurring element used to build the first atomic bombs was uranium in its natural form \(\text{U}^{238}\) . Only one 140th of it is \(\text{U}^{235}\) , the much more fissile isotope. The third element used was \(\text{Pu}^{239}\) , which can only be synthetically generated as a byproduct of a slow nuclear chain reaction. As we will see in the graphics and table below, the latter two elements have much better fission properties than the naturally occurring \(\text{U}^{238}\) . From this stemmed the biggest challenge on the route to build the first atomic bomb: build the industry necessary to enrich \(\text{U}^{235}\) (as was done in Oak Ridge through diffusion and electromagnetic separation techniques) or synthesize \(\text{Pu}^{239}\) in atomic reactors (as was done in Hanford). Both processes were very difficult to invent and required major financial and workforce investments. This is often an overlooked point from the Second World War: only the United States was economically able to build up this industry from scratch; all other nations had war fields on their mainland.
Now we will look into two important graphs. The first one shows the energy of incoming neutrons versus the fission cross section for the three materials at hand. The message is that \(\text{U}^{235}\) and \(\text{Pu}^{239}\) are much more fissile than the naturally occurring \(\text{U}^{238}\) . The second graphic shows the distribution of the energy of emitted neutrons from a fission process. These distributions for the three materials look almost the same.
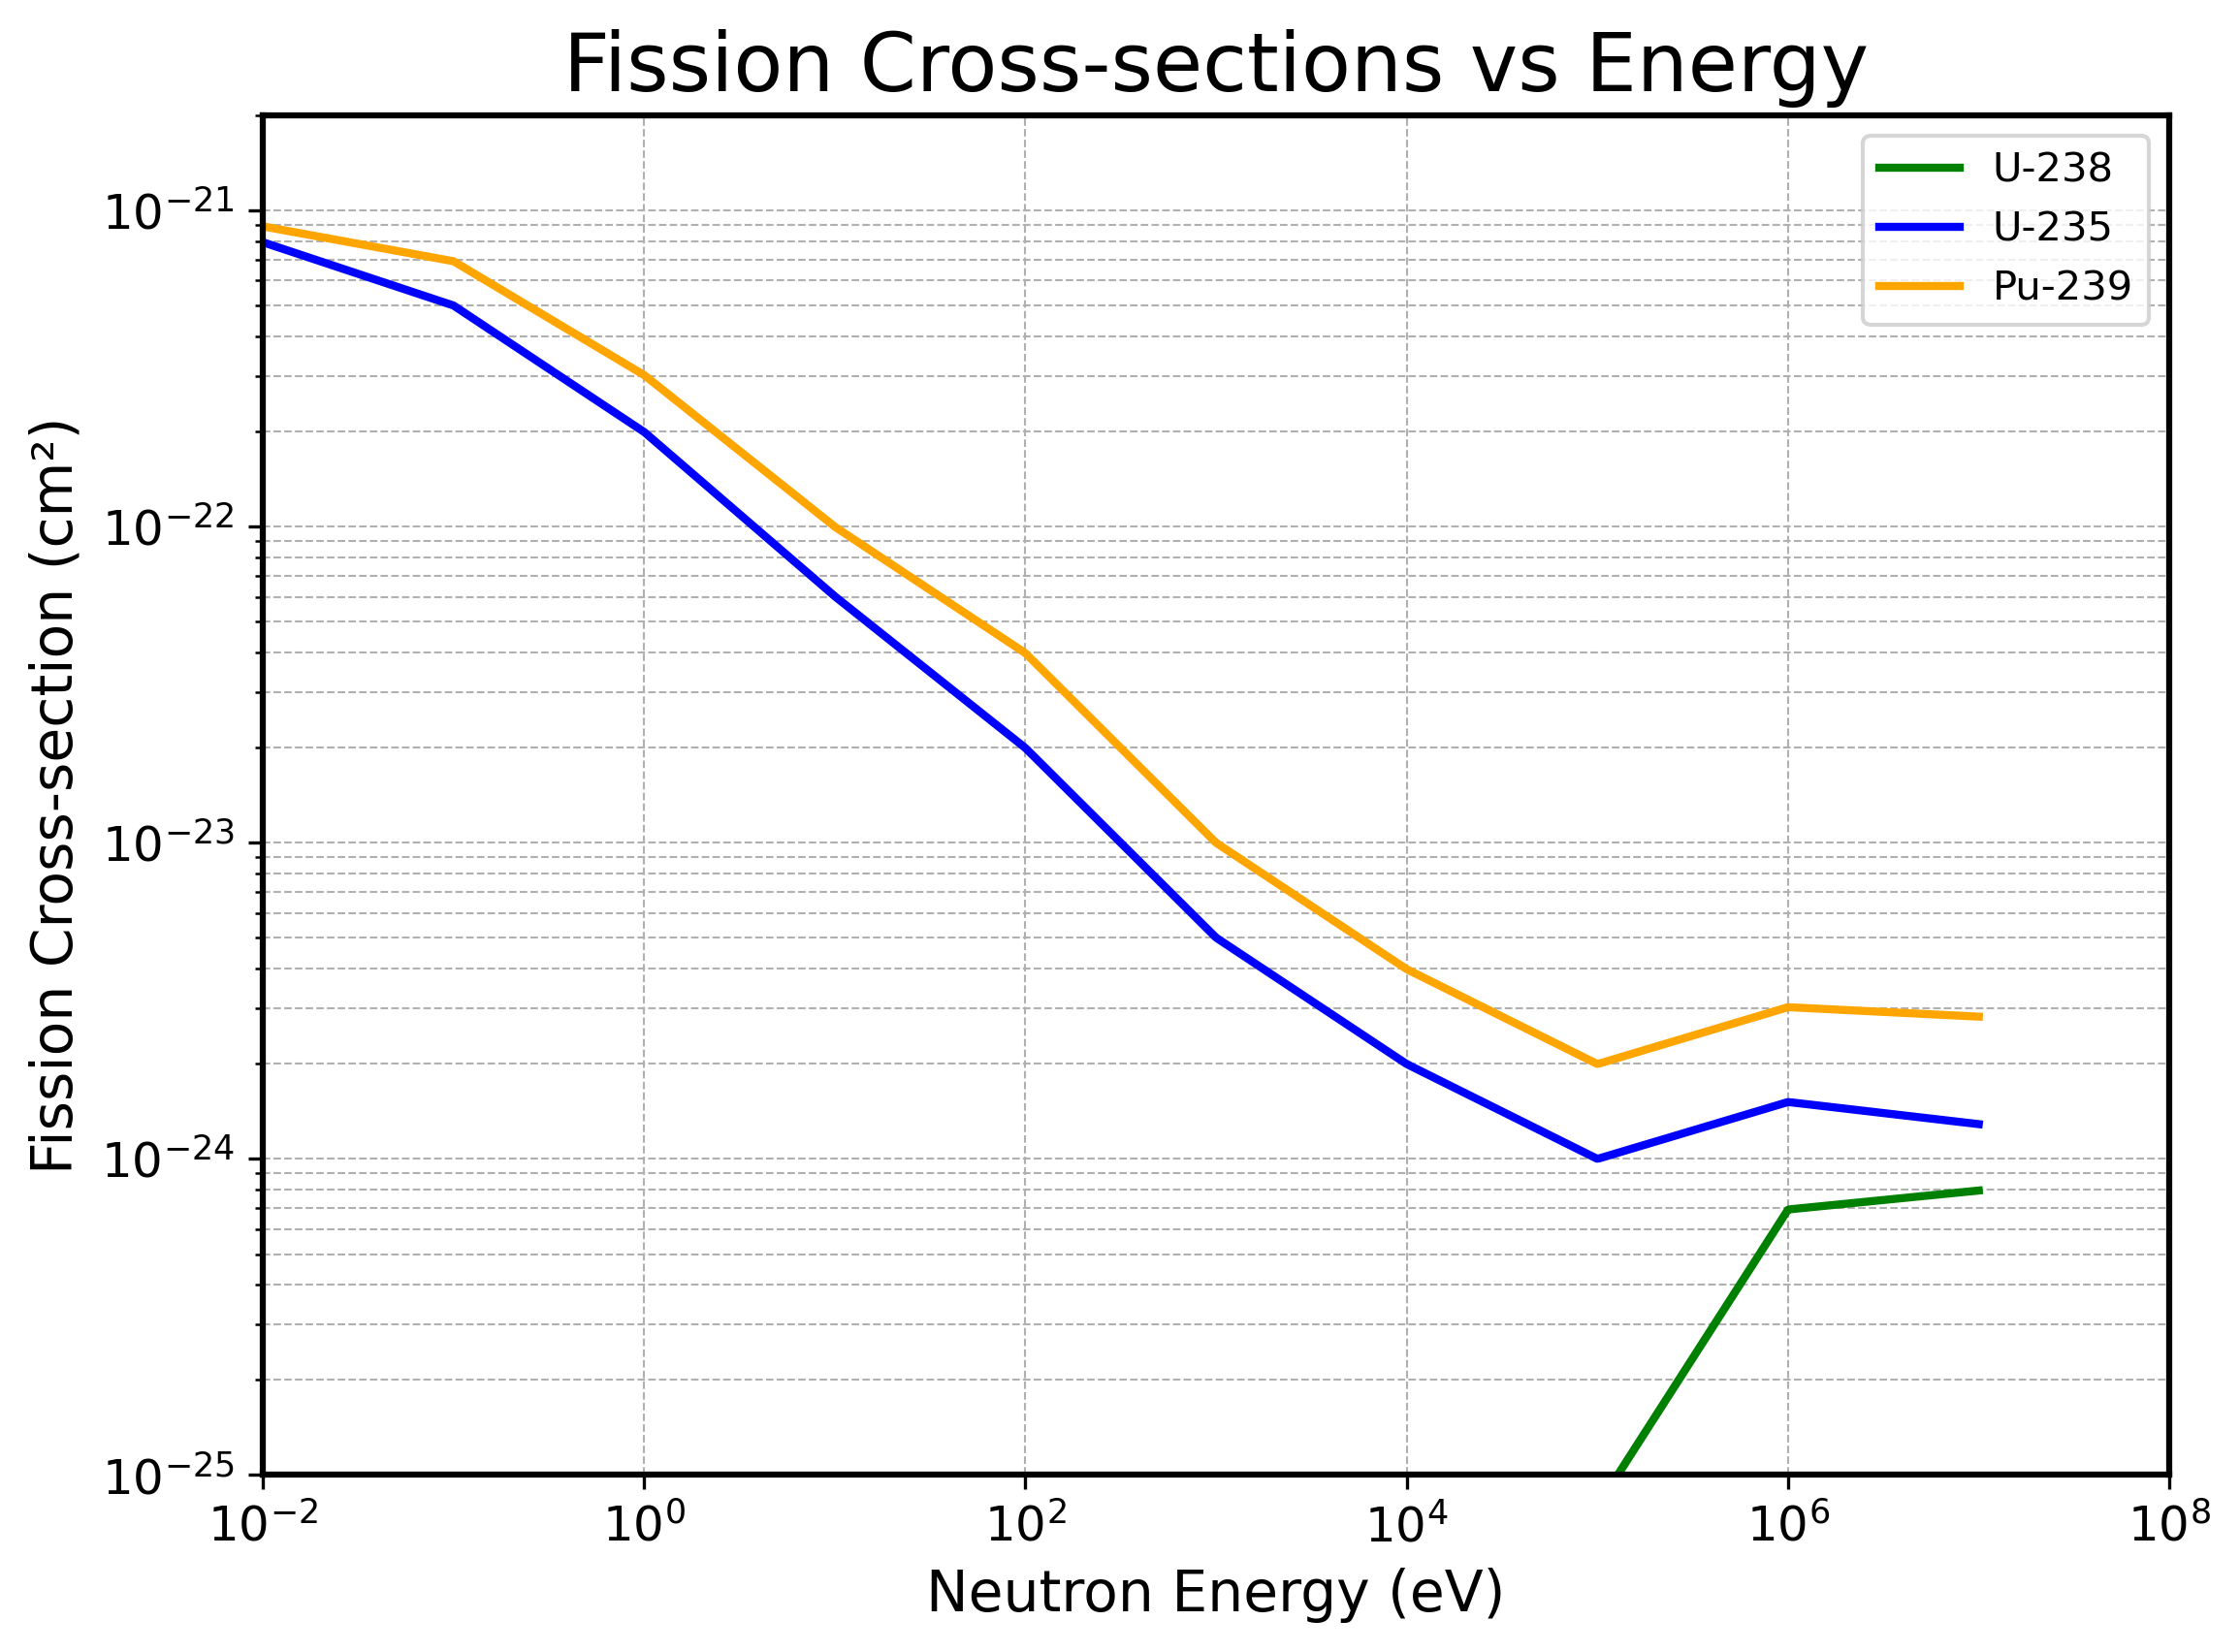
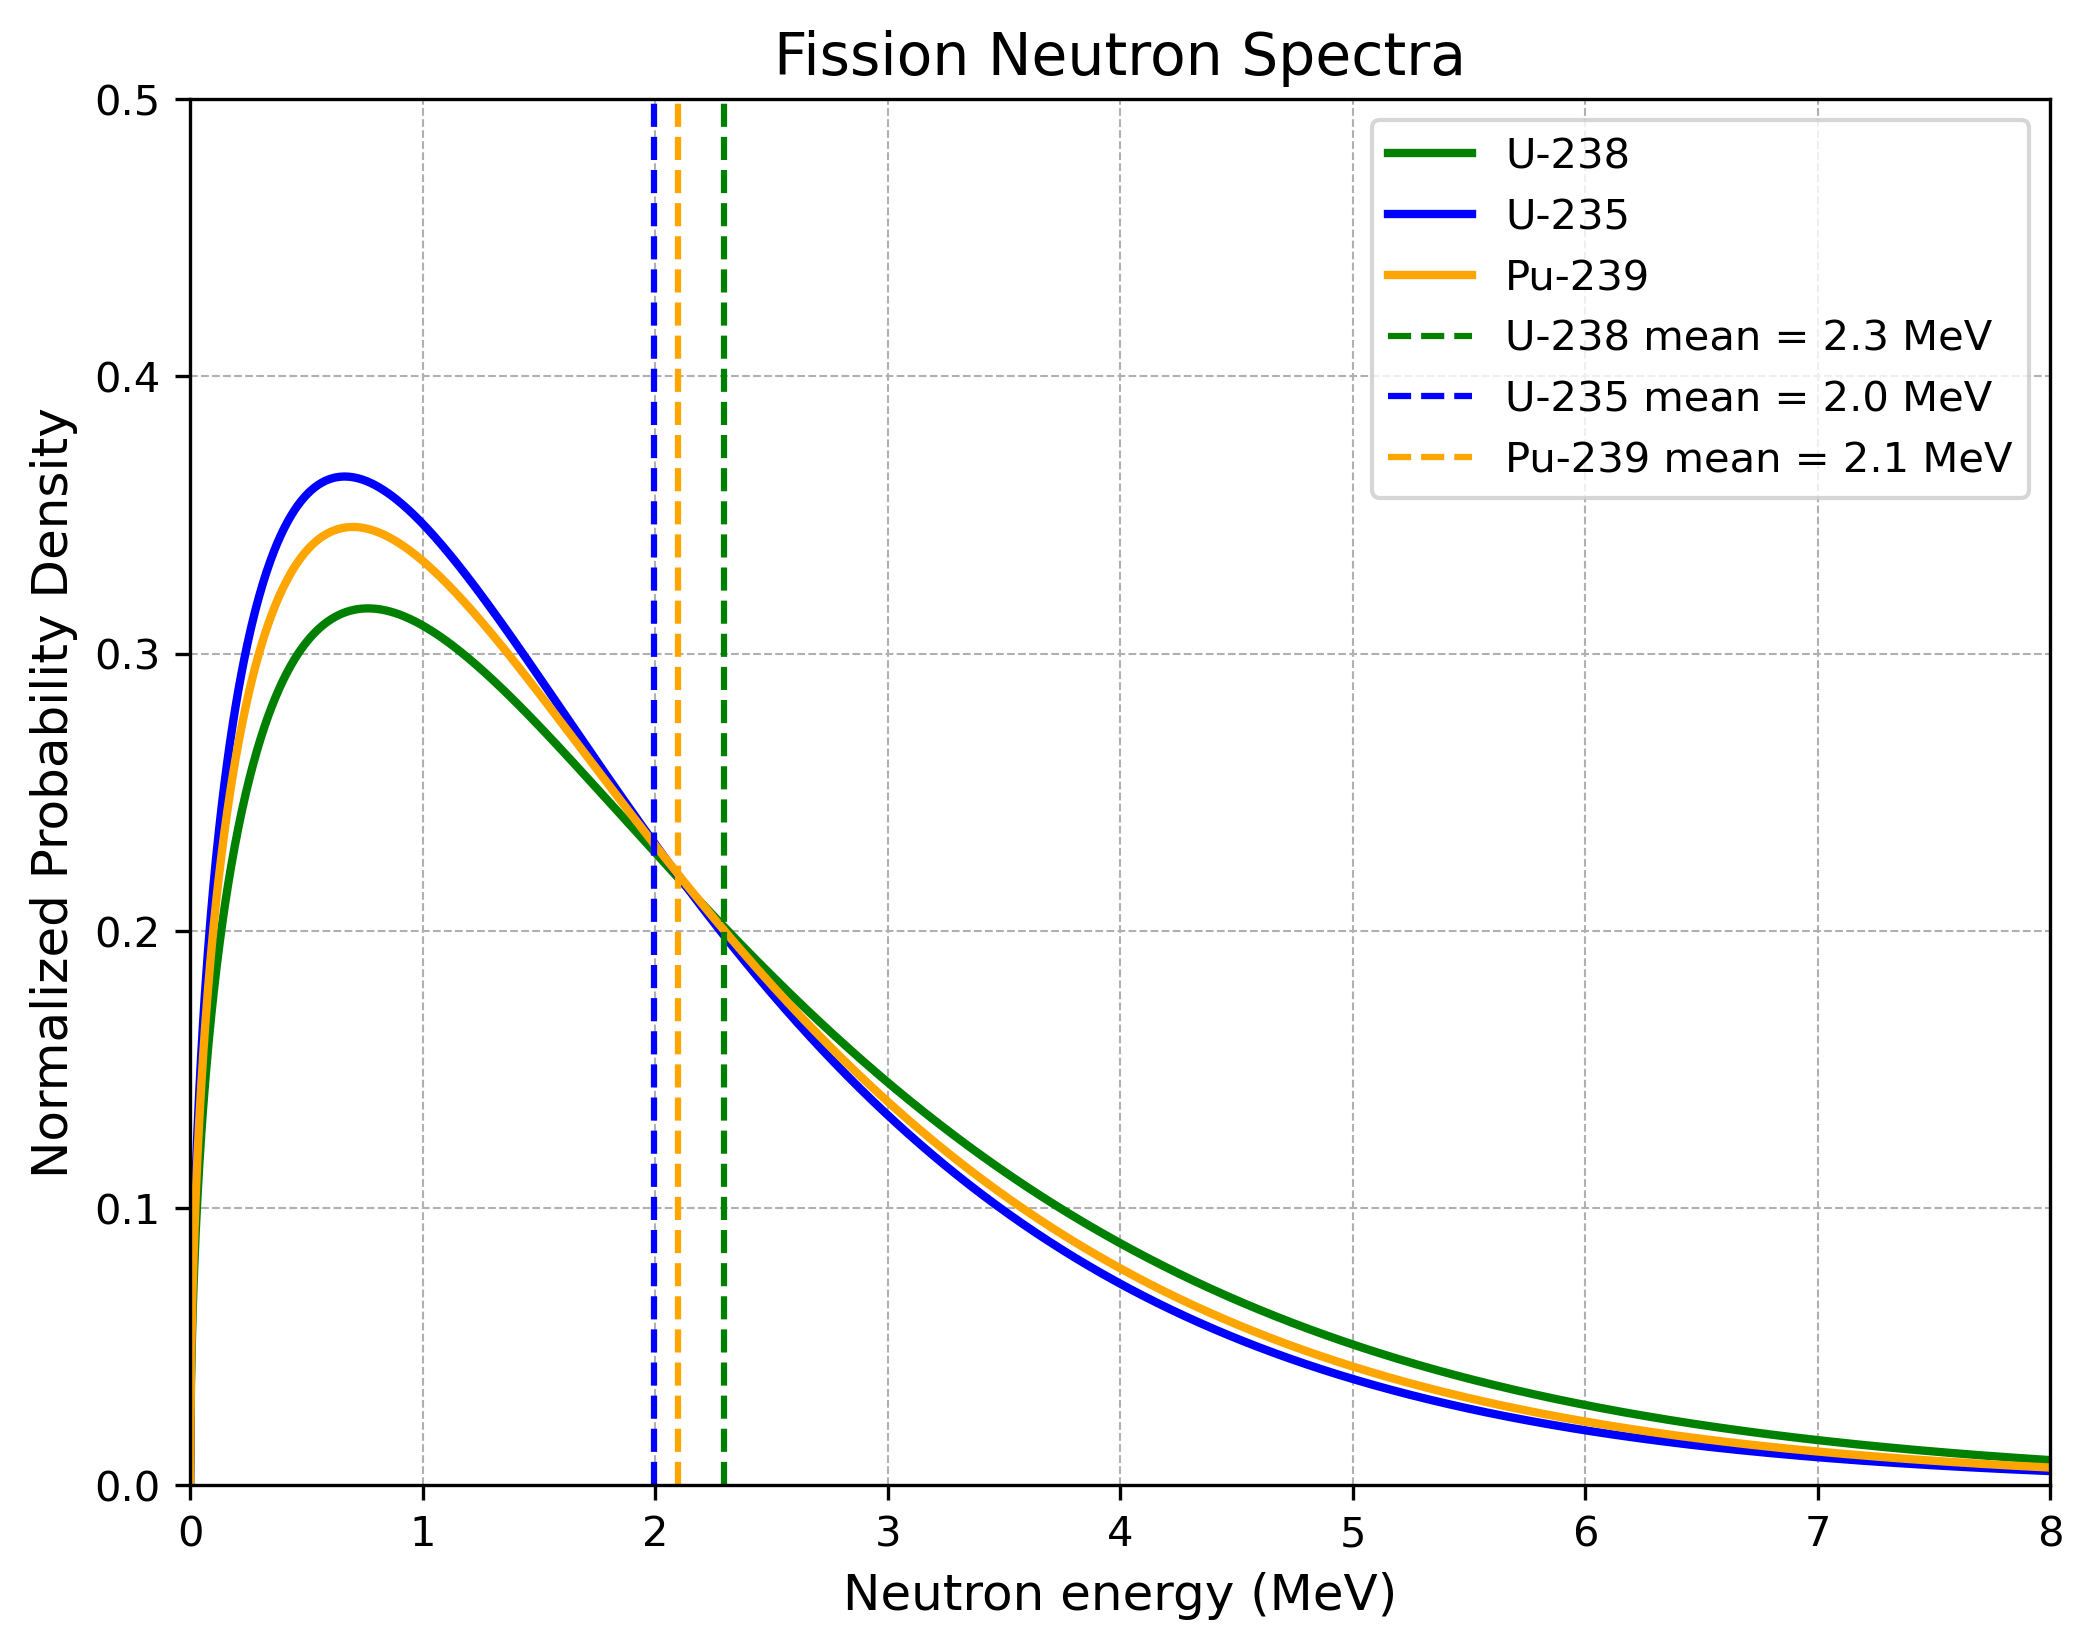
The key story from these two plots would suggest harnessing slow neutron fission in order to exploit large fission cross sections and use all the slow emitted neutrons from the occurring fission processes. Although these facts are used in nuclear reactors, it is not possible to exploit them in an atomic bomb. Why this is the case will be clarified in the coming section.
What about the neutron numbers? Below in the table you will see estimates used back then and the actual values measured nowadays for neutron numbers and fission cross sections (these are values for energetic incoming neutrons from the graph above). Also shown is the quantity \((\tip{\nu}{neutron number: neutrons released per fission, on average} - 1) \times \tip{\sigma_f}{fission cross section: the effective target area for fission}\) , since neutron number and fission cross section will always arise in this combination in the upcoming calculations about critical masses. It is fascinating that the estimates of the individual values were quite off; however, the combined term was very close to the actual value. (The fission cross sections are given in \(10^{-24} \text{ cm}^2\) .)
| Isotope | \(\tip{\sigma_f}{fission cross section: the effective target area for fission}\)
(early estimate) |
\(\tip{\sigma_f}{fission cross section: the effective target area for fission}\)
(actual) |
\(\tip{\nu}{neutron number: neutrons released per fission, on average}\)
(early estimate) |
\(\tip{\nu}{neutron number: neutrons released per fission, on average}\)
(actual) |
\((\tip{\nu}{neutron number: neutrons released per fission, on average}-1)\,\tip{\sigma_f}{fission cross section: the effective target area for fission}\)
(early estimate) |
\((\tip{\nu}{neutron number: neutrons released per fission, on average}-1)\,\tip{\sigma_f}{fission cross section: the effective target area for fission}\)
(actual) |
|---|---|---|---|---|---|---|
| U‑235 | 1.5 | 1.22 | 2.20 | 2.52 | 1.80 | 1.85 |
| Pu‑239 | 3.0 | 1.73 | 2.20 | 2.95 | 3.60 | 3.40 |
The Material Properties, One by One
Everything that follows, the critical mass, the efficiency and the bomb design, rests on a handful of numbers that belong to the material. None of them can be calculated from first principles. They have to be measured, and in 1943 there was barely any material to measure them with. That is why the early estimates in the table are off.
\[ \tip{\lambda_f}{mean free path: average distance a neutron flies before it causes a fission} = \frac{1}{\tip{n}{number of nuclei per cubic centimetre}\,\tip{\sigma_f}{fission cross section: the effective target area for fission}}. \]For \(\text{U}^{235}\) this is about \(17 \text{ cm}\) . Keep this number in mind: it is the same order as the critical radius we will calculate below, and that is no coincidence.
Neutron number \(\tip{\nu}{neutron number: neutrons released per fission, on average}\) . A single fission releases 2 or 3 neutrons, sometimes 1 or 4. \(\tip{\nu}{neutron number: neutrons released per fission, on average}\) is the average. Measuring it means counting neutrons from individual fissions, with detectors of the 1940s and a few micrograms of plutonium.
The combination \((\tip{\nu}{neutron number: neutrons released per fission, on average} - 1)\,\tip{\sigma_f}{fission cross section: the effective target area for fission}\) . One neutron is used up to cause a fission, so every fission gives a net gain of \(\tip{\nu}{neutron number: neutrons released per fission, on average} - 1\) neutrons. \(\tip{\sigma_f}{fission cross section: the effective target area for fission}\) says how likely a neutron is to cause that fission on its way through the material. The product is the net number of new neutrons gained per distance flown. A material with many neutrons per fission but a tiny cross section is as useless as one with a big cross section that releases barely more than one neutron. Only the product counts, and since the critical mass depends only on the product (see the formula at the end of the Critical Mass section), the errors in the individual estimates hardly mattered.
\[ \tip{v}{speed of a fission neutron} = \sqrt{\frac{2\tip{E}{kinetic energy of the neutron, about 2 MeV}}{\tip{m_n}{mass of a neutron}}} \approx 2 \times 10^{7} \tfrac{\text{m}}{\text{s}}, \] \[ \tip{\tau}{generation time: average time between two fissions in the chain} = \frac{\tip{\lambda_f}{mean free path: average distance a neutron flies before it causes a fission}}{\tip{v}{speed of a fission neutron}} \approx \frac{0.17 \text{ m}}{2 \times 10^{7} \text{ m/s}} \approx 10^{-8} \text{ s}. \]This is the generation time that shows up in every calculation below.
The numbers behind the mean free path and the generation time
so \(\tip{\tau}{generation time: average time between two fissions in the chain} \approx 0.17 / (1.96 \times 10^{7}) \text{ s} \approx 8.6 \times 10^{-9} \text{ s}\) .
Why \(\text{U}^{238}\) does not work. \(\text{U}^{238}\) does fission, but only when hit by a neutron with more than about \(1 \text{ MeV}\) . Most fission neutrons lose energy in their first collisions (inelastic scattering) and drop below this threshold, so a chain reaction in \(\text{U}^{238}\) dies out. The reason lies in how neutrons pair up inside the nucleus. When \(\text{U}^{235}\) absorbs a neutron, it becomes \(\text{U}^{236}\) with an even number of neutrons, the new neutron finds a partner and releases about \(6.5 \text{ MeV}\) . That is more than the roughly \(6 \text{ MeV}\) barrier the nucleus has to overcome to split, so even a neutron at rest causes fission. \(\text{U}^{238}\) becomes \(\text{U}^{239}\) with an odd number of neutrons, gains only about \(4.8 \text{ MeV}\) , and the missing energy has to come from the speed of the incoming neutron. \(\text{Pu}^{239}\) behaves like \(\text{U}^{235}\) . Materials of this kind are called fissile.
Why the Materials Were So Hard to Make
The physics in this Primer fits on a few blackboards. The materials did not. Of the roughly $2 billion the Manhattan Project cost, about 80 % went into the production sites at Oak Ridge and Hanford, and less than 5 % into Los Alamos.
Uranium-235. Natural uranium contains only \(0.7\) % of \(\text{U}^{235}\) , and a bomb needs it enriched to around \(80\) % or more. The problem: both isotopes are uranium, chemically they are identical. No chemical reaction can tell them apart. The only handle is their mass, which differs by about \(1\) %. Oak Ridge ran three methods in a chain, each feeding the next:
- Thermal diffusion (S-50): uranium in liquid form between a hot and a cold pipe, the lighter isotope gathers slightly at the hot side. A small first step.
- Gaseous diffusion (K-25): uranium is turned into a gas, uranium hexafluoride, and pumped through porous barriers. Lighter molecules are slightly faster and pass slightly more often. One stage enriches by a factor of only \(\sqrt{352/349} \approx 1.004\) , so thousands of stages have to run in series. K-25 had about 3,000 and was the largest building in the world at the time. The gas is extremely corrosive, and the barriers, with billions of microscopic holes, had to be invented first.
- Electromagnetic separation (Y-12): giant mass spectrometers, the calutrons. Uranium ions are shot through a magnetic field, the lighter ones fly on a slightly tighter circle and are caught in a separate pocket. Copper was needed for the war, so the magnet coils were wound from about 14,000 tons of silver borrowed from the US Treasury. The output was measured in grams per day.
By the summer of 1945 all of this together had produced about 64 kg of enriched uranium: exactly one bomb, Little Boy.
Plutonium-239. Plutonium does not exist in nature. It is made in a reactor. \(\text{U}^{238}\) captures a neutron and becomes \(\text{U}^{239}\) , which decays within about 23 minutes into neptunium-239, which decays within about 2.4 days into \(\text{Pu}^{239}\) . This needed, first, a working reactor at all (Chicago Pile-1, December 1942) and then industrial production reactors at Hanford, cooled by the Columbia River (the B Reactor started in September 1944). A tonne of uranium irradiated for months yields only a few hundred grams of plutonium. Since plutonium is a different element, it can be separated chemically, which is easier in principle than isotope separation. But the irradiated fuel is so radioactive that every step had to be done by remote control, behind metres of concrete.
And there was a twist. The longer the uranium stays in the reactor, the more plutonium captures a second neutron and becomes \(\text{Pu}^{240}\) , which fissions spontaneously. Reactor plutonium therefore always carries a background of stray neutrons. In the gun design, where the two halves come together slowly, these neutrons would start the chain reaction too early and the bomb would fizzle. This forced the much harder implosion design described below.
Slow vs. Fast Fission
Now we have to clarify why slow neutron fission cannot be used. It would indeed be very nice to exploit the larger fission cross section that arises from quantum effects when slow neutrons split nuclei (as the graphics from above showed for \(\text{U}^{235}\) and \(\text{Pu}^{239}\) ). Slow neutron fission is used in nuclear reactors. The key difference between a bomb and a reactor lies in the effective neutron reproduction factor: in a reactor it is controlled to be around \(1\) , while in an atomic bomb it is at or higher than \(2\) . In order to keep the reproduction factor at about \(1\) , the emitted neutrons have to be absorbed by moderating materials and slowed down (primarily by elastic scattering). The low reproduction number also ensures that the energy released remains at a controllable level and the reactor does not overheat.
If this factor is high, massive amounts of energy are released in a small volume, causing the material to expand very quickly. A quick calculation shows why this is the case. If we assume that \(1\) % of the energy from splitting one uranium atom (mass \(\tip{m}{mass of one uranium atom}=3.88 \times 10^{-25}\text{ kg}\) ) converts into expansion speed using \(\tip{E}{kinetic energy}=\frac{1}{2} \tip{m}{mass of one uranium atom} \tip{v}{expansion speed of the bomb material}^2\) , and that each atom releases \(\tip{E}{energy released per fission} = 200\text{ MeV} \approx 3.2 \times 10^{-11}\text{ J}\) , then:
\[ 0.01 \times 3.2 \times 10^{-11} = \frac{1}{2} \times 3.88 \times 10^{-25} \times \tip{v}{expansion speed of the bomb material}^2 \Longrightarrow \tip{v}{expansion speed of the bomb material} \approx 1.3 \times 10^6 \tfrac{\text{m}}{\text{s}}.\]At such speeds, the density of the bomb material drops rapidly and the system becomes subcritical, stopping the chain reaction in about \(10^{-8}\text{ sec}\) . This is why an atomic bomb cannot rely on slow-neutron fission, despite its higher cross sections: there is simply no time or mechanism for neutrons to be moderated and slowed down, and the rapidly expanding bomb material ensures that fast fission remains the dominating process.
Critical Mass
In order to calculate a reasonable estimate for the critical mass of a specific geometry and material, the scientists in Los Alamos first employed standard diffusion theory, with later refinements, to obtain an approximate result. Although the simple diffusion theory from statistical mechanics does not apply exactly (since the mean free paths of neutrons often exceed the characteristic dimensions of the system), it is sufficient to yield a rough estimate for the critical mass. We have previously estimated that the time between fission events is on the order of \( \tip{\tau}{generation time: average time between two fissions in the chain} \approx 10^{-8} \text{ s},\) and that the average number of neutrons produced per fission, \(\tip{\nu}{neutron number: neutrons released per fission, on average}\) , is between \(2\) and \(3\) . The idea is a simple balance. Inside the material, every fission produces new neutrons. At the surface, neutrons escape and are lost. The production grows with the volume, the loss with the surface, so there is a size at which production just keeps up with the loss: the critical size.
The diffusion equation
It is important to note that \(\tip{\dot{N}}{rate of change of the neutron number over time}\) represents a time derivative, while the Laplacian operator \(\tip{\nabla^2}{Laplacian: how much N bulges compared with its surroundings}\) (arising from the divergence of the gradient) involves spatial derivatives.
Separating the equation and solving the sphere
after plugging in into the equation above and simplifying we get to \(\tip{\nu'}{effective neutron number: growth rate of the neutron population} = (\tip{\nu}{neutron number: neutrons released per fission, on average} - 1) - \frac{\pi^2 \tip{D}{diffusion constant: how fast neutrons spread out} \tip{\tau}{generation time: average time between two fissions in the chain}}{\tip{R}{radius of the sphere}^2}.\) Setting this equal to zero and solving for \(\tip{R}{radius of the sphere}\) gives the critical radius.
using the density \(\tip{\rho}{density of the uranium metal}\approx 19\text{g/cm}^3\) and the volume formula for a sphere.
Play with \(\nu\) and \(D\tau\) below to see how sensitive the critical mass is to these two material properties, and compare the sphere directly against a cube of equal critical status.
The cube, and where the factor 1.24 comes from
Comparing the volumes at equal critical status, the cube holds \(\tip{a_{\rm crit}}{critical side length of the cube}^3 = 3^{3/2}\tip{R_{\rm crit}}{critical radius: smallest sphere that sustains the chain reaction}^3\) while the sphere holds \(\frac{4}{3}\pi \tip{R_{\rm crit}}{critical radius: smallest sphere that sustains the chain reaction}^3\) , and the ratio is \(3^{5/2}/(4\pi)\approx1.24\) .
Efficiency
A second major factor in the Manhattan Project was to maximize the efficiency of the bomb. Efficiency here is defined as the ratio between the actual energy released by fission and the theoretical maximum if all the fissile material were to fission. Our estimates before were an efficiency on the order of 1%. Now we have to clarify where this estimate comes from. The main reason is that the chain reaction ends when the bomb expands rapidly and the density falls below the critical level. Furthermore, we will see that larger bombs, which have multiples of the critical mass, have a higher efficiency.
\[\tip{f}{efficiency: fraction of the material that fissions} = \frac{(\tip{\nu}{neutron number: neutrons released per fission, on average} - 1)^2 \tip{R_{cn}}{critical radius at normal density}^2}{8\tip{E}{fission energy per kilogram of material} \tip{\tau}{generation time: average time between two fissions in the chain}^2} \tip{\delta}{excess radius: how far the bomb is above the critical radius, as a fraction}^2.\]Working out the efficiency
so the excess factor is \(\tip{\delta}{excess radius: how far the bomb is above the critical radius, as a fraction} \approx 0.26\) .
\[ \tip{v}{outward speed of the expanding material} \approx \frac{\tip{\nu'}{effective neutron number: growth rate of the neutron population}}{\tip{\tau}{generation time: average time between two fissions in the chain}}(\tip{R}{current radius of the expanding bomb} - \tip{R_n}{initial radius of the bomb}),\] \[\tip{v}{outward speed of the expanding material} \approx \frac{\tip{\nu}{neutron number: neutrons released per fission, on average} - 1}{\tip{\tau}{generation time: average time between two fissions in the chain}}\left(\frac{1}{2} \tip{\delta}{excess radius: how far the bomb is above the critical radius, as a fraction} \tip{R_{cn}}{critical radius at normal density}\right),\] \[\frac{1}{2}\tip{v}{outward speed of the expanding material}^2 \approx \frac{1}{2}\left[\frac{(\tip{\nu}{neutron number: neutrons released per fission, on average} - 1) \tip{\delta}{excess radius: how far the bomb is above the critical radius, as a fraction} \tip{R_{cn}}{critical radius at normal density}}{2 \tip{\tau}{generation time: average time between two fissions in the chain}}\right]^2 = \frac{(\tip{\nu}{neutron number: neutrons released per fission, on average} - 1)^2 \tip{\delta}{excess radius: how far the bomb is above the critical radius, as a fraction}^2 \tip{R_{cn}}{critical radius at normal density}^2}{8 \tip{\tau}{generation time: average time between two fissions in the chain}^2}.\]Setting this equal to the fraction \(\tip{f}{efficiency: fraction of the material that fissions}\) of the available fission energy, \(\tip{f}{efficiency: fraction of the material that fissions} \tip{E}{fission energy per kilogram of material} = \frac{(\tip{\nu}{neutron number: neutrons released per fission, on average} - 1)^2 \tip{\delta}{excess radius: how far the bomb is above the critical radius, as a fraction}^2 \tip{R_{cn}}{critical radius at normal density}^2}{8 \tip{\tau}{generation time: average time between two fissions in the chain}^2}\) , and solving for \(\tip{f}{efficiency: fraction of the material that fissions}\) gives the result above.
or about 2%. Within the uncertainties and simplifications of this model, this result is on the order of 1% efficiency.
Thus, even though a bomb with twice the critical mass starts out substantially supercritical, the rapid hydrodynamic expansion limits the time available for additional fission generations, so that only about 1% of the fissile material actually undergoes fission. We see that efficiency is an important topic and area where improvements could be made. Also, modern values are about 1-5%.
One percent sounds like a failed experiment. Ninety-nine percent of the most expensive material on earth at the time was blown apart before it could do anything. And yet that one percent flattened a city. Both things are true at once, and that is the part worth sitting with. The energy density of fission is so far beyond anything chemical that even a badly inefficient bomb is a catastrophe. Being bad at this still gets you Hiroshima.
Tamper
Tamper is an additional layer of material placed around the enriched core. It serves two main purposes:
-
Neutron Reflection: The tamper reflects neutrons that would otherwise escape through the boundary back into the material. This improves the boundary conditions in the diffusion equation, thereby reducing the critical mass required to sustain a chain reaction. For example, a tamper layer about 2-3 cm thick, made of a high-density material like gold or \(\text{U}^{238}\) , can reduce the critical mass by roughly a factor of 4 compared to a bare core.
-
Inertial Delay: The tamper adds mass to the bomb, increasing its inertia. This extra mass slows down the expansion of the core during the explosion. Although this delay gives the chain reaction a bit more time to proceed, the overall impact on efficiency is limited. In the context of the Primer, even with the tamper the efficiency remains very low (not much bigger than the 1-2% from before), because the time scale for the chain reaction is extremely short (around \(\tip{\tau}{generation time: average time between two fissions in the chain} \sim 10^{-8}\) s).
In summary, while the tamper can significantly reduce the critical mass by improving neutron retention, its effect on the overall efficiency of the explosion is relatively modest.
The tamper sounds like the fix, and it is not. Efficiency stays roughly where it was, because nothing can outrun a generation time of \(10^{-8}\) s. A few centimetres of gold buy you a small delay against a process that is already over. It was still clearly worth it, just for the other reason. Cutting the critical mass by a factor of 4 mattered enormously when the scarce resource was not cleverness but kilograms of enriched uranium, produced over years at industrial scale. The tamper did not make the bomb better. It made the bomb possible sooner.
Bomb Design
The first main approach to actually build a bomb that creates a critical mass and releases a large amount of energy was the gun-type design. The key idea was to shoot two parts of subcritical material at each other using ordinary explosives, so they would combine into a critical assembly. The Little Boy bomb dropped on Hiroshima (using \(\text{U}^{235}\) ) was such a design. In practice, the projectile section traveled at roughly \(300 \text{ m/s}\) , but even at this relatively high speed, much of the material fizzled, which meant partial and premature fission, resulting in a relatively low efficiency (as seen in the earlier table).
The second, much more difficult, yet ingenious, approach was the implosion-type design. The Trinity Test and the bomb thrown on Nagasaki, Fat Man was of such design. Since the critical mass depends on density (as indicated by the formula from the “Critical Mass” section), the idea was to ignite ordinary explosives around a subcritical sphere of \(\text{Pu}^{239}\) , thereby compressing it, increasing its density, and causing it to become critical. Additionally, these explosives served as tamper material to help confine the assembly and reduce the critical mass. This design posed a major engineering and physics challenge, as it involved calculating shock waves propagating through multiple materials and estimating the effectiveness of the explosive lenses. Without modern computers, carrying out these fluid dynamics calculations took significant time and the success of this approach was uncertain for a very long time.
Where Did All This Lead?
This last section is mainly about the destructive power and the harm caused by the bombs developed over the two years following these basic calculations. It is brutal and very sad, and I do not want to write around that. But I think dropping them saved lives on balance. Japan gave every indication of fighting to the very end, and an invasion of the home islands would have cost far more, on both sides. There is also a question that is easy to skip past. How does a country send its own soldiers to die when it is holding an alternative?
Was one bomb enough? Probably. Retrospect makes the whole thing look like a calculation, with the options laid out and a decision taken. It was not like that. Decisions were made in days, on bad information, by people who could not see the end of the war from where they stood.
The part that stays with me is not the moral ledger. It is that knowledge only moves one way. Once the calculations in this Primer existed, nobody could un-know them. The physics was straightforward enough that it was never going to belong to one country. That is why the Primer still reads as current, and it is the same thing happening now with AI. A discovery gets made, the world reorganises around it, and there is no going back. Which leaves only one real job: reap the positives, hold the negatives down, and make sure the total comes out a large net positive.
Certainly, building an atomic bomb or a reactor requires extensive engineering and an entire industry to supply the raw materials. Still, it is enlightening to see that with relatively basic assumptions and Newtonian physics, the scientists were able to deduce the main principles and reach conclusions that guided the project. Furthermore, reading the Primer highlights the fundamental assumptions under which the researchers operated at the time.
The destruction caused by the first atomic bombs dropped on Hiroshima and Nagasaki on August 6th and 9th, 1945, had multiple facets. The most obvious, though not necessarily the most dangerous, is the radioactivity. There is also the massive explosion resulting from the released energy. This energy acts in two ways. First, it creates a shock wave that destroys buildings and people within a certain radius. Second, a large fireball is formed by the intense heat; this fireball not only burns down buildings and the surrounding area, but also almost certainly generates a massive firestorm that can consume an even larger region through wind and convection.
Acute fatalities were approximately 70,000 in Hiroshima and 40,000 in Nagasaki. Within one year, the cumulative death toll had risen to roughly 140,000 in Hiroshima and 70,000 in Nagasaki. Additionally, many people later succumbed to injuries or radiation-induced illnesses in the years that followed.
Radioactivity
First, we need a few basics on radioactivity in general. If we say a material has one decay per second, it means that one nucleus of the material transforms each second. This decay can happen via alpha radiation (helium nuclei), beta radiation (electrons or positrons), or gamma radiation (high-energy photons). The half-life describes how long it takes for half of all nuclei in a sample to decay.
The unit of one decay event per second is the Becquerel (Bq). (Other units include the Curie (Ci), where \(1 \text{ Ci} \approx 3.7 \times 10^{10} \text{ Bq}\) , and the Rutherford (Rd), where \(1 \text{ Rd} = 10^6 \text{ Bq} = 1 \text{ MBq}\) .) These units measure radioactive activity: how many nuclei decay per second in a sample. That says nothing yet about what happens to a body standing next to it. For that, three steps lead from the radiation to the health risk, and the Sievert (Sv) sits at the end of this chain. It is an aggregate unit: one number that folds together how much energy is absorbed, what kind of radiation delivers it, and which organs receive it.
\[ \tip{D}{absorbed dose: radiation energy absorbed per kilogram of tissue} = \frac{\tip{E_{\text{abs}}}{radiation energy absorbed by the tissue}}{\tip{m}{mass of the tissue}}, \qquad 1 \text{ Gy} = 1 \text{ J/kg}. \]This is pure physics, and the energies are tiny. A lethal dose of \(5\) Gy would warm the body by about a thousandth of a degree. The damage does not come from heat but from broken molecules, above all broken DNA.
\[ \tip{H_T}{equivalent dose in organ T} = \sum_{\tip{R}{type of radiation}} \tip{w_R}{radiation weighting factor: how damaging this type of radiation is per joule} \, \tip{D_{T,R}}{absorbed dose in organ T from radiation type R}, \]with \(\tip{w_R}{radiation weighting factor: how damaging this type of radiation is per joule} = 1\) for gamma and beta radiation, \(20\) for alpha particles, and between \(2.5\) and \(20\) for neutrons, depending on their energy. The weighting factor has no unit, so a Sievert is still a J/kg. The new name signals that the weighting is included.
\[ \tip{E}{effective dose: one number for the whole body} = \sum_{\tip{T}{organ or tissue}} \tip{w_T}{tissue weighting factor: share of the total risk this organ carries} \, \tip{H_T}{equivalent dose in organ T}, \]with \(\tip{w_T}{tissue weighting factor: share of the total risk this organ carries} = 0.12\) for bone marrow, lung, stomach, colon, breast and the remaining organs together, \(0.08\) for the gonads, \(0.04\) for thyroid, liver, bladder and oesophagus, and \(0.01\) for skin, bone surface, brain and salivary glands.
An example makes this concrete. Inhaled radon deposits alpha radiation in the lung. Say the lung absorbs \(1\) mGy. The equivalent dose of the lung is \(20 \times 1 = 20\) mSv, and the effective dose is \(0.12 \times 20 = 2.4\) mSv. That is about one year of natural background radiation, from a single organ and an absorbed energy that is almost nothing.
So the effective dose answers one question: what whole-body dose of gamma radiation would carry the same long-term risk? As a rule of thumb, \(1\) Sv of effective dose raises the lifetime risk of dying from cancer by about \(5\) %. One caveat: this weighting was built for small doses and long-term cancer risk. For high acute doses, which cause radiation sickness within days, what counts is the absorbed dose in Gray to the bone marrow and the gut. For gamma rays both numbers are the same (\(\tip{w_R}{radiation weighting factor: how damaging this type of radiation is per joule} = 1\) ), which is why acute doses are often still quoted in Sv, as below. Older units you will meet in historical sources are the rad (\(0.01\) Gy) and the rem (\(0.01\) Sv). The Roentgen (R) is not a dose at all: it measures how strongly radiation ionises air.
Typical background radiation levels are around 2-3 millisieverts (mSv) per year. Areas are often considered risky if they exceed tens of mSv per year. For acute exposures, about 0.5-1 Sv can lead to noticeable radiation sickness, 2-5 Sv may cause severe sickness, and doses above 5 Sv can be lethal to around half of those exposed.
Immediately after the bombings in 1945, survivors near ground zero were exposed to acute doses on the order of 1-6 Sv. In the months that followed, fallout and residual radiation contributed an additional dose of roughly 0.5-1 Sv. Over the subsequent years, as short-lived isotopes decayed, environmental dose rates in Hiroshima and Nagasaki eventually dropped to near-natural levels of about 0.2-0.3 mSv per year. Today, background radiation in these cities is similar to that in other urban areas, typically on the order of 1-2 mSv per year.
In Hiroshima, approximately 5-15% of all acute fatalities were directly caused by radiation sickness, while in the months after the bombing, most additional deaths were also attributable to radiation-induced illnesses. A similar pattern was seen in Nagasaki.
Blast Wave and Firestorm
The bombs were dropped from an altitude of around 9,400 m, but each was set to explode at roughly 600 m above the ground to maximize destructive effects. Of the approximately 20 kilotons of TNT equivalent, about 40-50 % went into the blast wave, 30-50 % into thermal radiation (intense heat and light), around 5 % into immediate nuclear radiation, and the remaining 5-10 % into residual radiation and the kinetic energy of bomb fragments.
The blast wave spread out spherically, causing buildings to collapse within a radius of about 1,500-2,000 m from ground zero. The extremely high temperatures ignited fires over roughly the same radius and triggered a firestorm similar to those caused by the incendiary attacks on Tokyo or Dresden, which, however, required thousands of conventional bombs rather than just a single device. Altogether, the blast wave and fireball accounted for about 80-90 % of the acute fatalities in the immediate aftermath.
Sources
- Source code for all graphs in the post can be found under: github
- The Los Alamos Primer by Robert Serber